
The average financial institution spends $2,600 per manual case review. That is not a typo, and it is not an edge case. It is operational reality for compliance teams running 500 to 2,000 KYC checks per month on a patchwork of spreadsheets, email chains, and vendor portals. When your board asks why onboarding takes 34 days and your best analysts keep leaving, the answer is not "we need more headcount." The answer is that your deployment model is wrong, and you have never had the benchmark data to prove it.
We built this guide because the data we kept seeing from vendors was, frankly, useless. Cherry-picked case studies. "Up to" claims with no methodology. ROI calculators that assume 100% automation rates on day one. Compliance directors deserve better. So we ran the numbers ourselves, modelled five deployment approaches against consistent assumptions, and published the results. No gates, no forms, no sales call required.
If you are evaluating KYC automation vendors, shortlisting deployment models, or trying to build a business case for your CFO, this is the comparison framework we wish had existed when we started.
Manual KYC costs more than you think it does
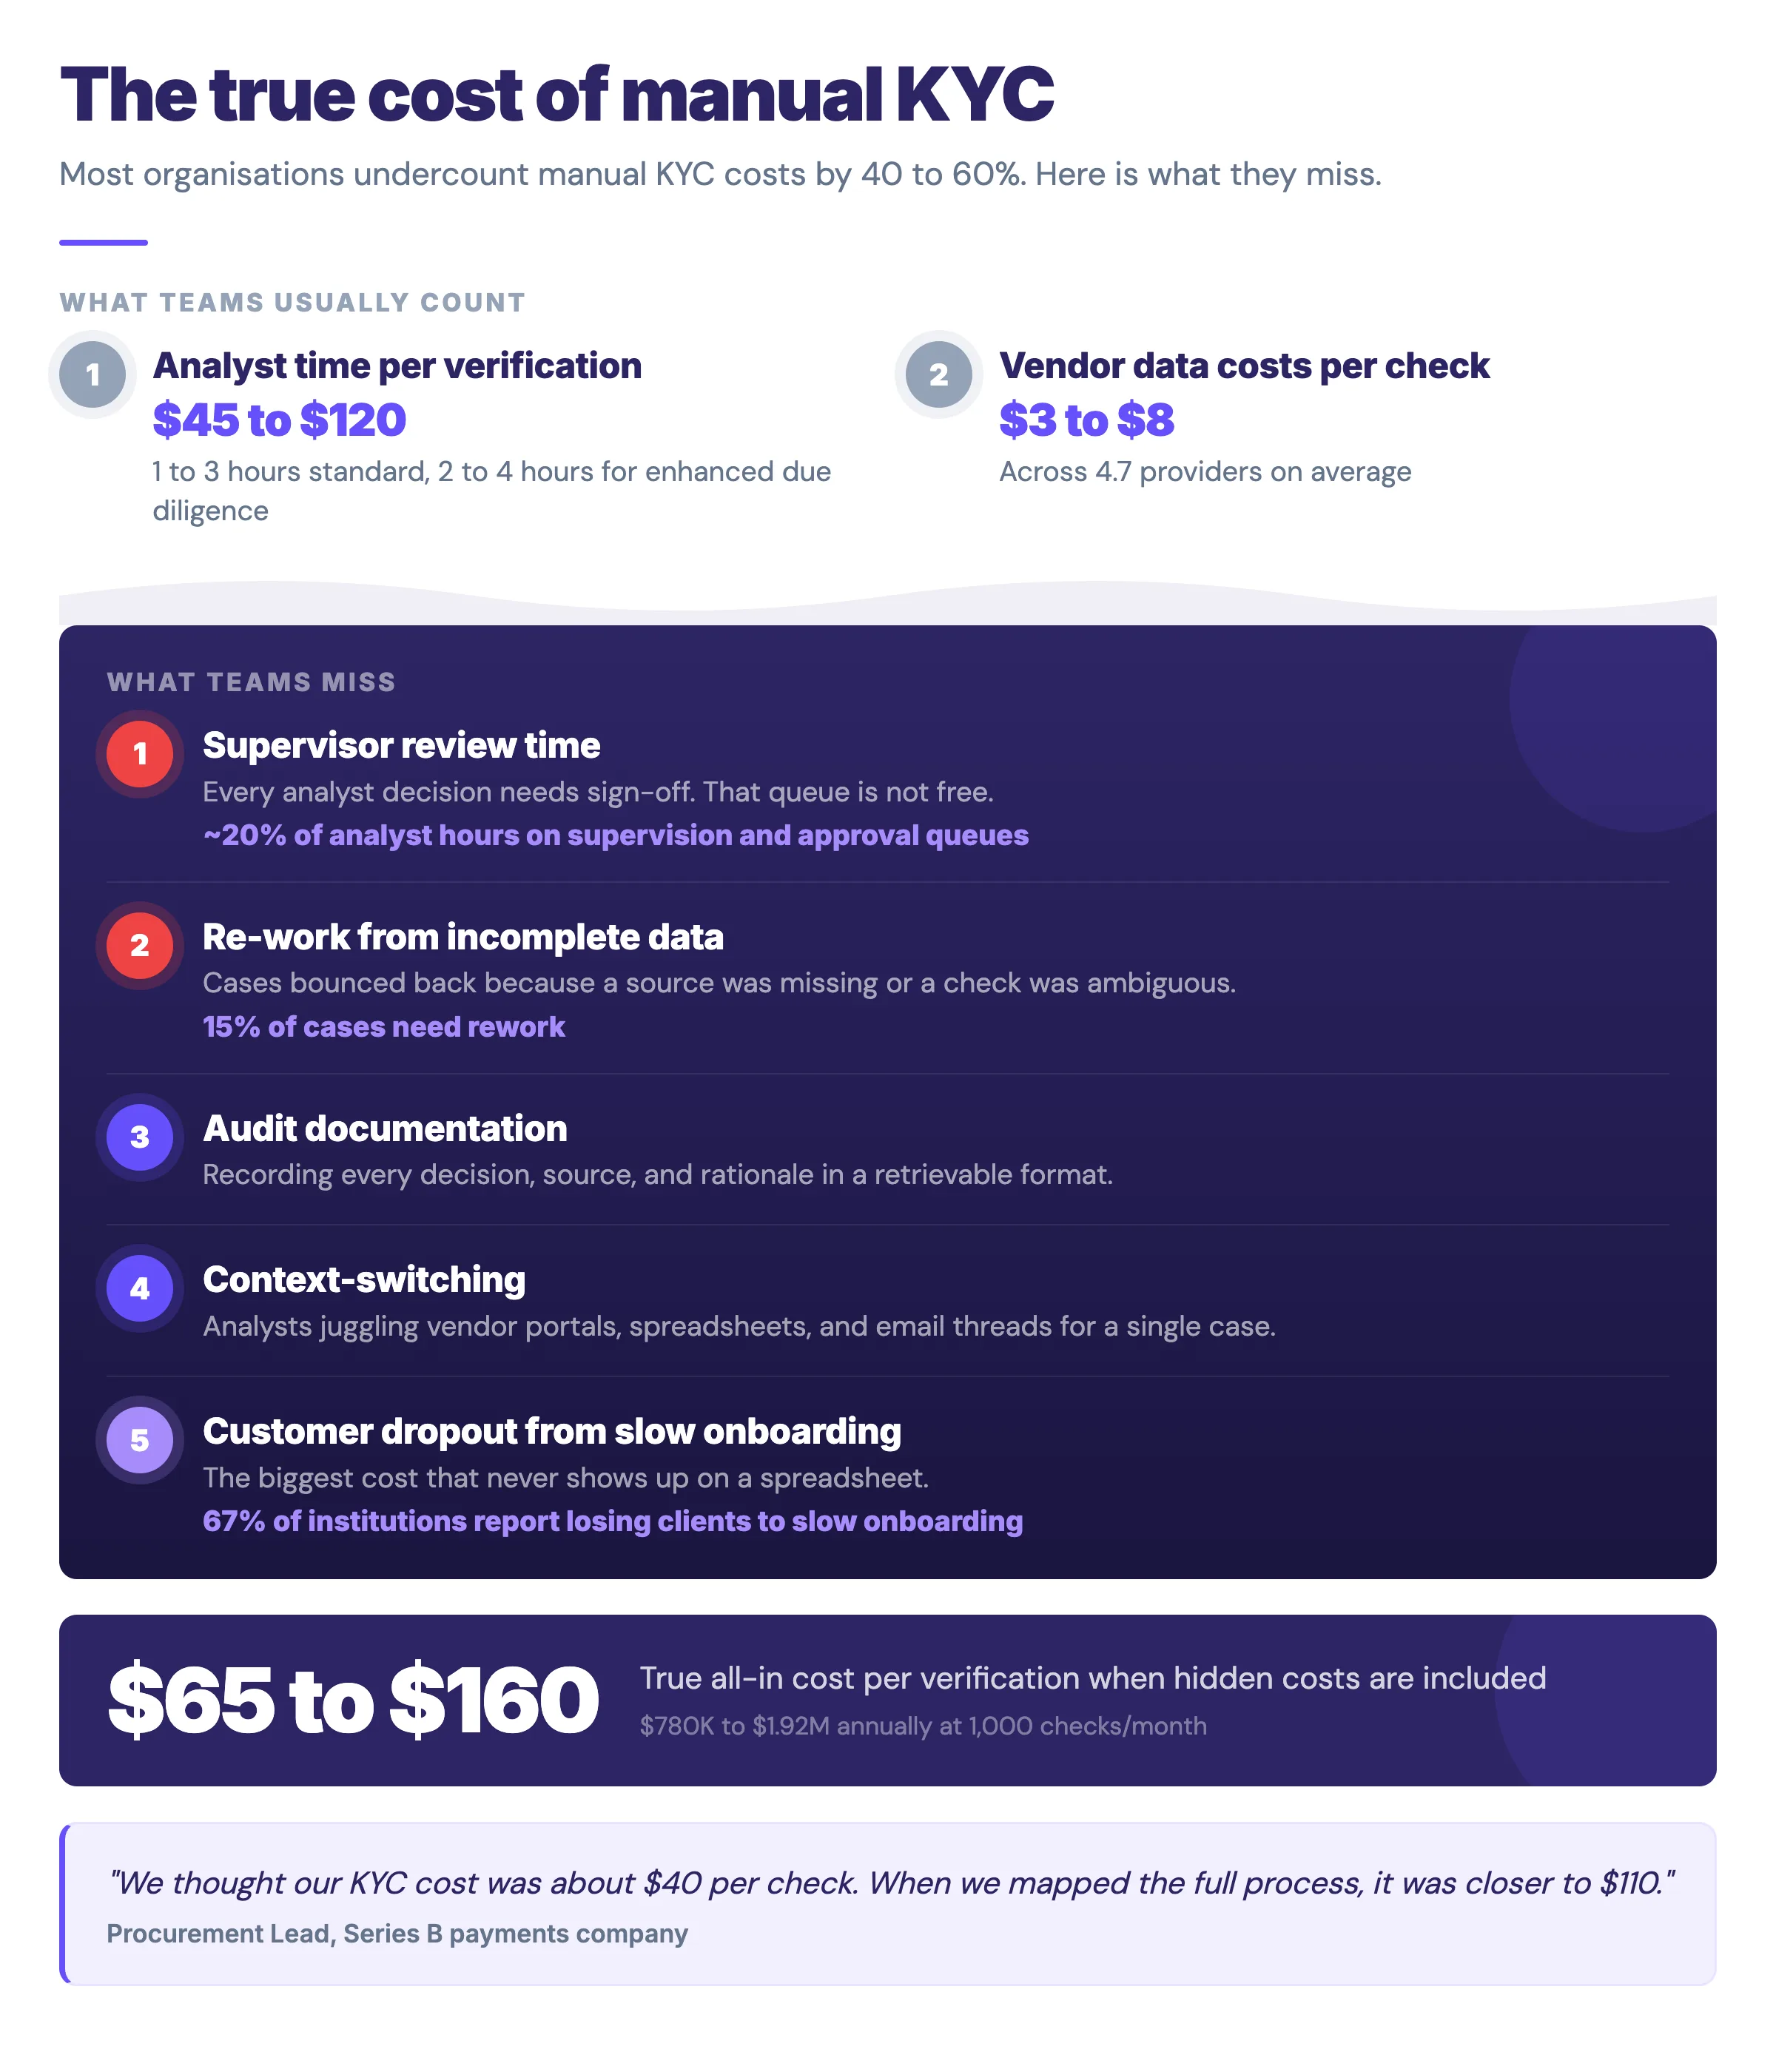
Before benchmarking any automation model, you need an honest baseline. Most organisations undercount manual KYC costs by 40 to 60% because they exclude the hidden line items: analyst context-switching time, supervisor review queues, re-work from incomplete data requests, and the compliance overhead of documenting every decision for audit purposes.
Here is what a realistic manual KYC operation looks like at 1,000 verifications per month. Analyst fully loaded cost sits around $75,000 to $95,000 per year in London or New York. Each standard verification takes 1 to 3 hours of analyst time, with enhanced due diligence cases running 2 to 4 hours. Factor in a 15% re-work rate (conservative, based on what we hear from compliance teams), and your effective cost per verification lands between $45 and $120, depending on risk tier and jurisdiction.
But that is just the direct labour. Add vendor data costs ($3 to $8 per check across 4.7 providers on average), supervisor review time (roughly 20% of analyst hours), and audit documentation overhead, and you are looking at $65 to $160 per verification, all-in. At 1,000 checks per month, that is $780,000 to $1.92 million annually. For a mid-market payments company. Before fines.
A Procurement Lead at a Series B payments company told us: "We thought our KYC cost was about $40 per check. When we actually mapped the full process, including the back-and-forth with customers for missing documents, it was closer to $110. That was the number that got our CEO's attention."
The turnaround time baseline matters too. Standard KYC averages 3 to 5 business days. Enhanced due diligence stretches to 10 to 15 days. High-risk corporate onboarding? Industry data shows 90 days is common. Every day of delay is a revenue event you are not capturing, and 67% of institutions report losing clients to slow onboarding (Fenergo 2024).
API-first automation is fast, but integration debt is real
The API-first model is the most common entry point for teams with engineering capacity. You pick a primary KYC provider, integrate their API, and route verifications programmatically. It works. But the benchmark data tells a more nuanced story than most vendors admit.
Speed gains are genuine. Automated identity verification via API typically completes in 15 to 45 seconds for standard checks, with document verification adding another 30 to 90 seconds. Compare that to 1 to 3 hours manually, and the turnaround improvement is dramatic: 95 to 99% reduction in processing time for straight-through cases.
Cost per verification drops significantly too, typically to $2 to $8 per check depending on the provider, check type, and volume tier. At 1,000 monthly verifications, you are looking at $24,000 to $96,000 annually in direct API costs. Against your $780,000+ manual baseline, that looks like an easy win.
Here is where procurement leads need to pay attention. Integration costs are the hidden variable. A single provider API integration typically runs $50,000 to $180,000 in engineering time, depending on your stack complexity and the quality of the provider's documentation. Ongoing maintenance adds 15 to 25% annually. And you are locked to one provider's data quality, coverage gaps, and pricing changes.
Accuracy rates for API-first models cluster around 85 to 92% for automated decisions, meaning 8 to 15% of cases still require manual review. That residual manual workload is often underestimated in vendor ROI models. For a 1,000-check-per-month operation, you are still manually handling 80 to 150 cases, which means you cannot fully reduce headcount the way the business case promised.
If you are modelling this for your own operation, we have built benchmarking tools that can map these numbers against your specific volumes and risk mix. Book a 30-minute session and we will run through your data together. No slides.
Hybrid automation looks flexible until you count the operational overhead
The hybrid model combines API automation with a configurable rules engine. Verifications flow through automated checks first, then route to manual review based on risk rules you define. It is the model most mid-market compliance teams graduate to, and on paper it offers the best of both worlds.
In practice, the benchmark data shows a more complicated picture. Straight-through processing rates for hybrid models range from 60 to 80%, depending on how conservatively your rules are configured. Most compliance teams, understandably, err on the side of caution.
A Head of Compliance at a UK challenger bank explained it to us this way: "We set our rules to auto-approve only the cleanest cases. Which meant we were manually reviewing 45% of checks in the first six months. It took another year of tuning to get that down to 25%."
Cost per verification in hybrid models typically sits between $5 and $15 when you blend automated and manual processing costs. The rules engine itself adds $30,000 to $80,000 annually in licensing, plus the engineering time to maintain and update rules as regulations change. That regulatory maintenance cost is almost never included in vendor pricing pages.
Turnaround times split dramatically. Automated approvals complete in under 2 minutes. Manually routed cases average 4 to 8 hours, because they now carry the overhead of case assignment, queue management, and priority scoring. The weighted average lands around 1 to 4 hours per verification, which is better than fully manual but nowhere near the "real-time" promise.
Accuracy is genuinely strong in hybrid models, typically 90 to 95%, because the rules engine catches edge cases that pure API automation misses. But maintaining that accuracy requires continuous rule tuning, and most teams do not have dedicated resources for it. Over 12 to 18 months, rule drift becomes a real problem: your false positive rate creeps up, your straight-through rate drops, and you end up back where you started, just with more expensive tooling.
Multi-provider orchestration delivers best-of-breed results, if you can manage the complexity
This is the model that procurement teams dream about and implementation teams dread. Instead of relying on a single provider, you route each verification through multiple specialised providers based on check type, jurisdiction, and risk tier. Identity verification from one vendor, sanctions screening from another, document verification from a third, corporate registry data from a fourth.
The benchmark results are compelling. Accuracy rates in well-implemented orchestration models reach 94 to 98%, because you are combining the strengths of specialist providers rather than accepting one generalist's weaknesses. Coverage gaps shrink dramatically. Where a single provider might cover 120 jurisdictions effectively, an orchestrated stack can cover 180 to 200 with genuine data depth.
Cost per verification is harder to model because it varies by routing logic. Simple cases might touch two providers at $4 to $6 total. Complex multi-jurisdictional corporate verifications can hit $25 to $40 across five or six providers. The blended average for a diversified portfolio typically lands between $8 and $18 per check.
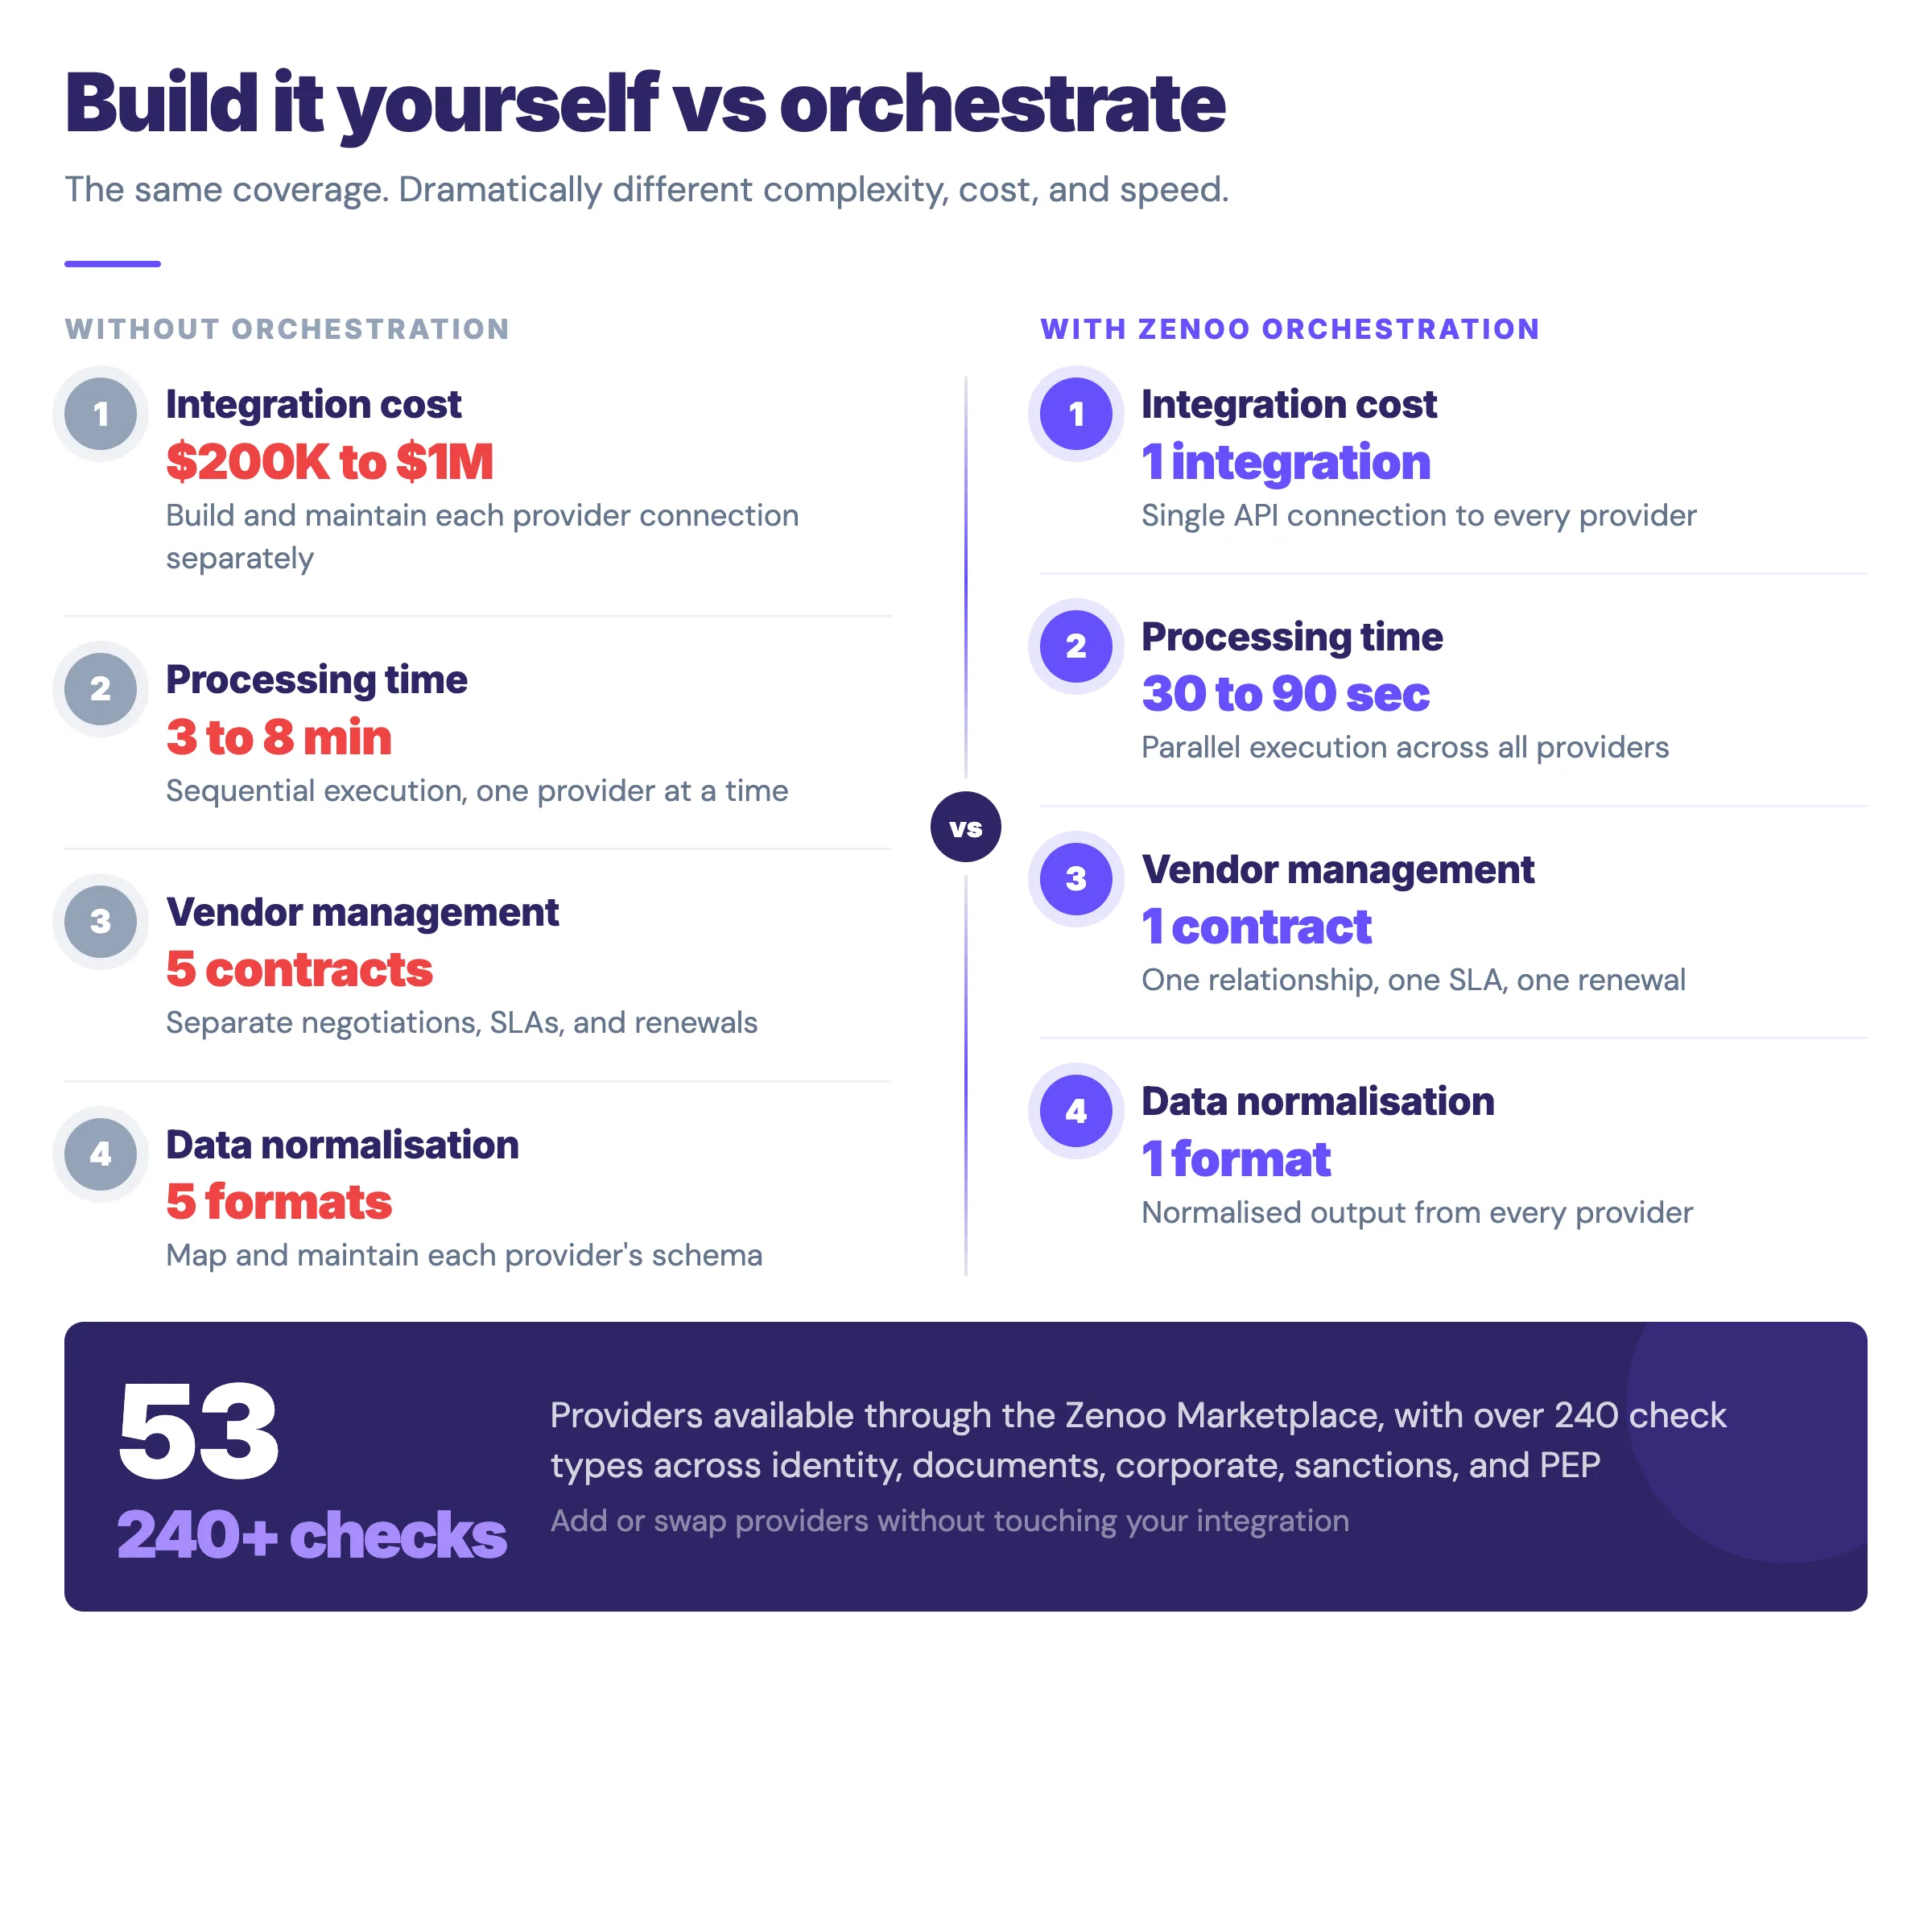
Here is the part that matters for your business case. Integration costs multiply. Each provider integration runs $50,000 to $180,000 individually. With four to six providers, you are looking at $200,000 to $1 million in initial integration work, plus ongoing maintenance across multiple APIs, data formats, and contract cycles. The average financial institution using 4.7 verification providers is spending more on vendor management than on the verifications themselves.
Turnaround time in orchestrated models depends entirely on whether you can run checks in parallel. Sequential routing (provider A, then B, then C) adds latency at every step, typically 3 to 8 minutes per verification. Parallel execution (all providers simultaneously, results merged) brings this down to 30 to 90 seconds for most standard cases, but requires significantly more engineering investment in the orchestration layer.
This is the model Zenoo was built to solve. Our Marketplace connects 53 providers across 240+ check types through a single integration point. Instead of building and maintaining six separate integrations, compliance teams route through one API with intelligent orchestration handling provider selection, parallel execution, and result normalisation. The economics shift fundamentally: one integration cost instead of six, one contract instead of six, one data format instead of six.
White-label SaaS gets you live fast, but the exit costs are brutal
The white-label model is attractive for speed-to-market. A SaaS provider handles the entire KYC workflow: UI, data providers, case management, reporting. You brand it, configure it, and go live in 2 to 6 weeks. For early-stage companies or those entering new markets, this time-to-value is hard to beat.
Cost structures are typically subscription-based: $5,000 to $25,000 per month depending on volume tier, plus per-check fees of $3 to $10. At 1,000 monthly verifications, annual cost ranges from $96,000 to $420,000. Competitive with other models, though the per-unit economics worsen at scale because you are paying for the platform overhead whether you use it or not.
Accuracy rates mirror the underlying provider's capability, usually 85 to 93%. You have limited ability to influence this because the data routing logic sits with the SaaS vendor, not with you. If their sanctions data source has gaps in a jurisdiction you care about, your options are limited to "ask them to add it" and "wait."
The FP&A team needs to model the exit scenario. White-label lock-in is real. Your customer data, workflow configurations, audit trails, and reporting all live in the vendor's infrastructure. Migration timelines typically run 3 to 6 months, with direct costs of $100,000 to $300,000 for data extraction, re-integration, and validation. That is before you account for the operational risk of running parallel systems during transition.
A Compliance Director at a European neobank shared their experience: "We went white-label to launch quickly, which worked. But two years later, when we needed to add specific screening capabilities for crypto assets, we were stuck. The provider did not support it, we could not integrate a third party, and switching would have taken six months. We ended up running a manual process alongside the platform for nearly a year."
The comparison matrix, with context that matters
Raw numbers without context are dangerous. The table below uses consistent assumptions: a mid-market financial services company running 1,000 KYC verifications per month across a mixed-risk portfolio (70% standard, 20% enhanced, 10% high-risk corporate). All costs are annualised and include hidden costs that vendors typically exclude.
| Metric | Manual | API-first | Hybrid (API + rules) | Multi-provider orchestration | White-label SaaS |
|---|---|---|---|---|---|
| Cost per verification (blended) | $65 to $160 | $2 to $8 | $5 to $15 | $8 to $18 | $11 to $45 |
| Annual cost (1,000/mo) | $780K to $1.92M | $24K to $96K | $60K to $180K | $96K to $216K | $96K to $420K |
| Turnaround (standard) | 3 to 5 days | 15 to 45 sec | 2 min to 4 hrs | 30 sec to 8 min | 1 to 10 min |
| Turnaround (enhanced) | 10 to 15 days | 2 to 5 min | 1 to 8 hrs | 2 to 15 min | 5 to 30 min |
| Accuracy rate | 92 to 97%* | 85 to 92% | 90 to 95% | 94 to 98% | 85 to 93% |
| Straight-through rate | 0% | 85 to 92% | 60 to 80% | 80 to 95% | 75 to 88% |
| Setup cost | $0 (status quo) | $50K to $180K | $80K to $250K | $200K to $1M | $10K to $50K |
| Setup time | N/A | 2 to 4 months | 3 to 6 months | 6 to 12 months | 2 to 6 weeks |
| Vendor lock-in risk | None | Medium | Medium-high | Low | High |
| Regulatory adaptability | High (manual flex) | Low | Medium | High | Low |
*Manual accuracy is high because humans catch nuance, but at enormous time cost and with consistency problems across analysts.
Three things stand out. First, API-first has the lowest per-unit cost, but the lowest accuracy. You save money and miss things. For regulated entities, that trade-off has consequences measured in enforcement actions, not percentages. Second, multi-provider orchestration delivers the best accuracy and coverage, but the setup cost barrier is prohibitive for most teams building it themselves. Third, white-label looks fast and affordable until you factor in the exit cost and the inability to adapt when regulations change.
How to benchmark your own implementation
Generic benchmarks are a starting point. Your specific economics depend on your verification volume, risk profile, jurisdictional mix, and existing team structure. Here is the framework we use when helping compliance teams model their options.
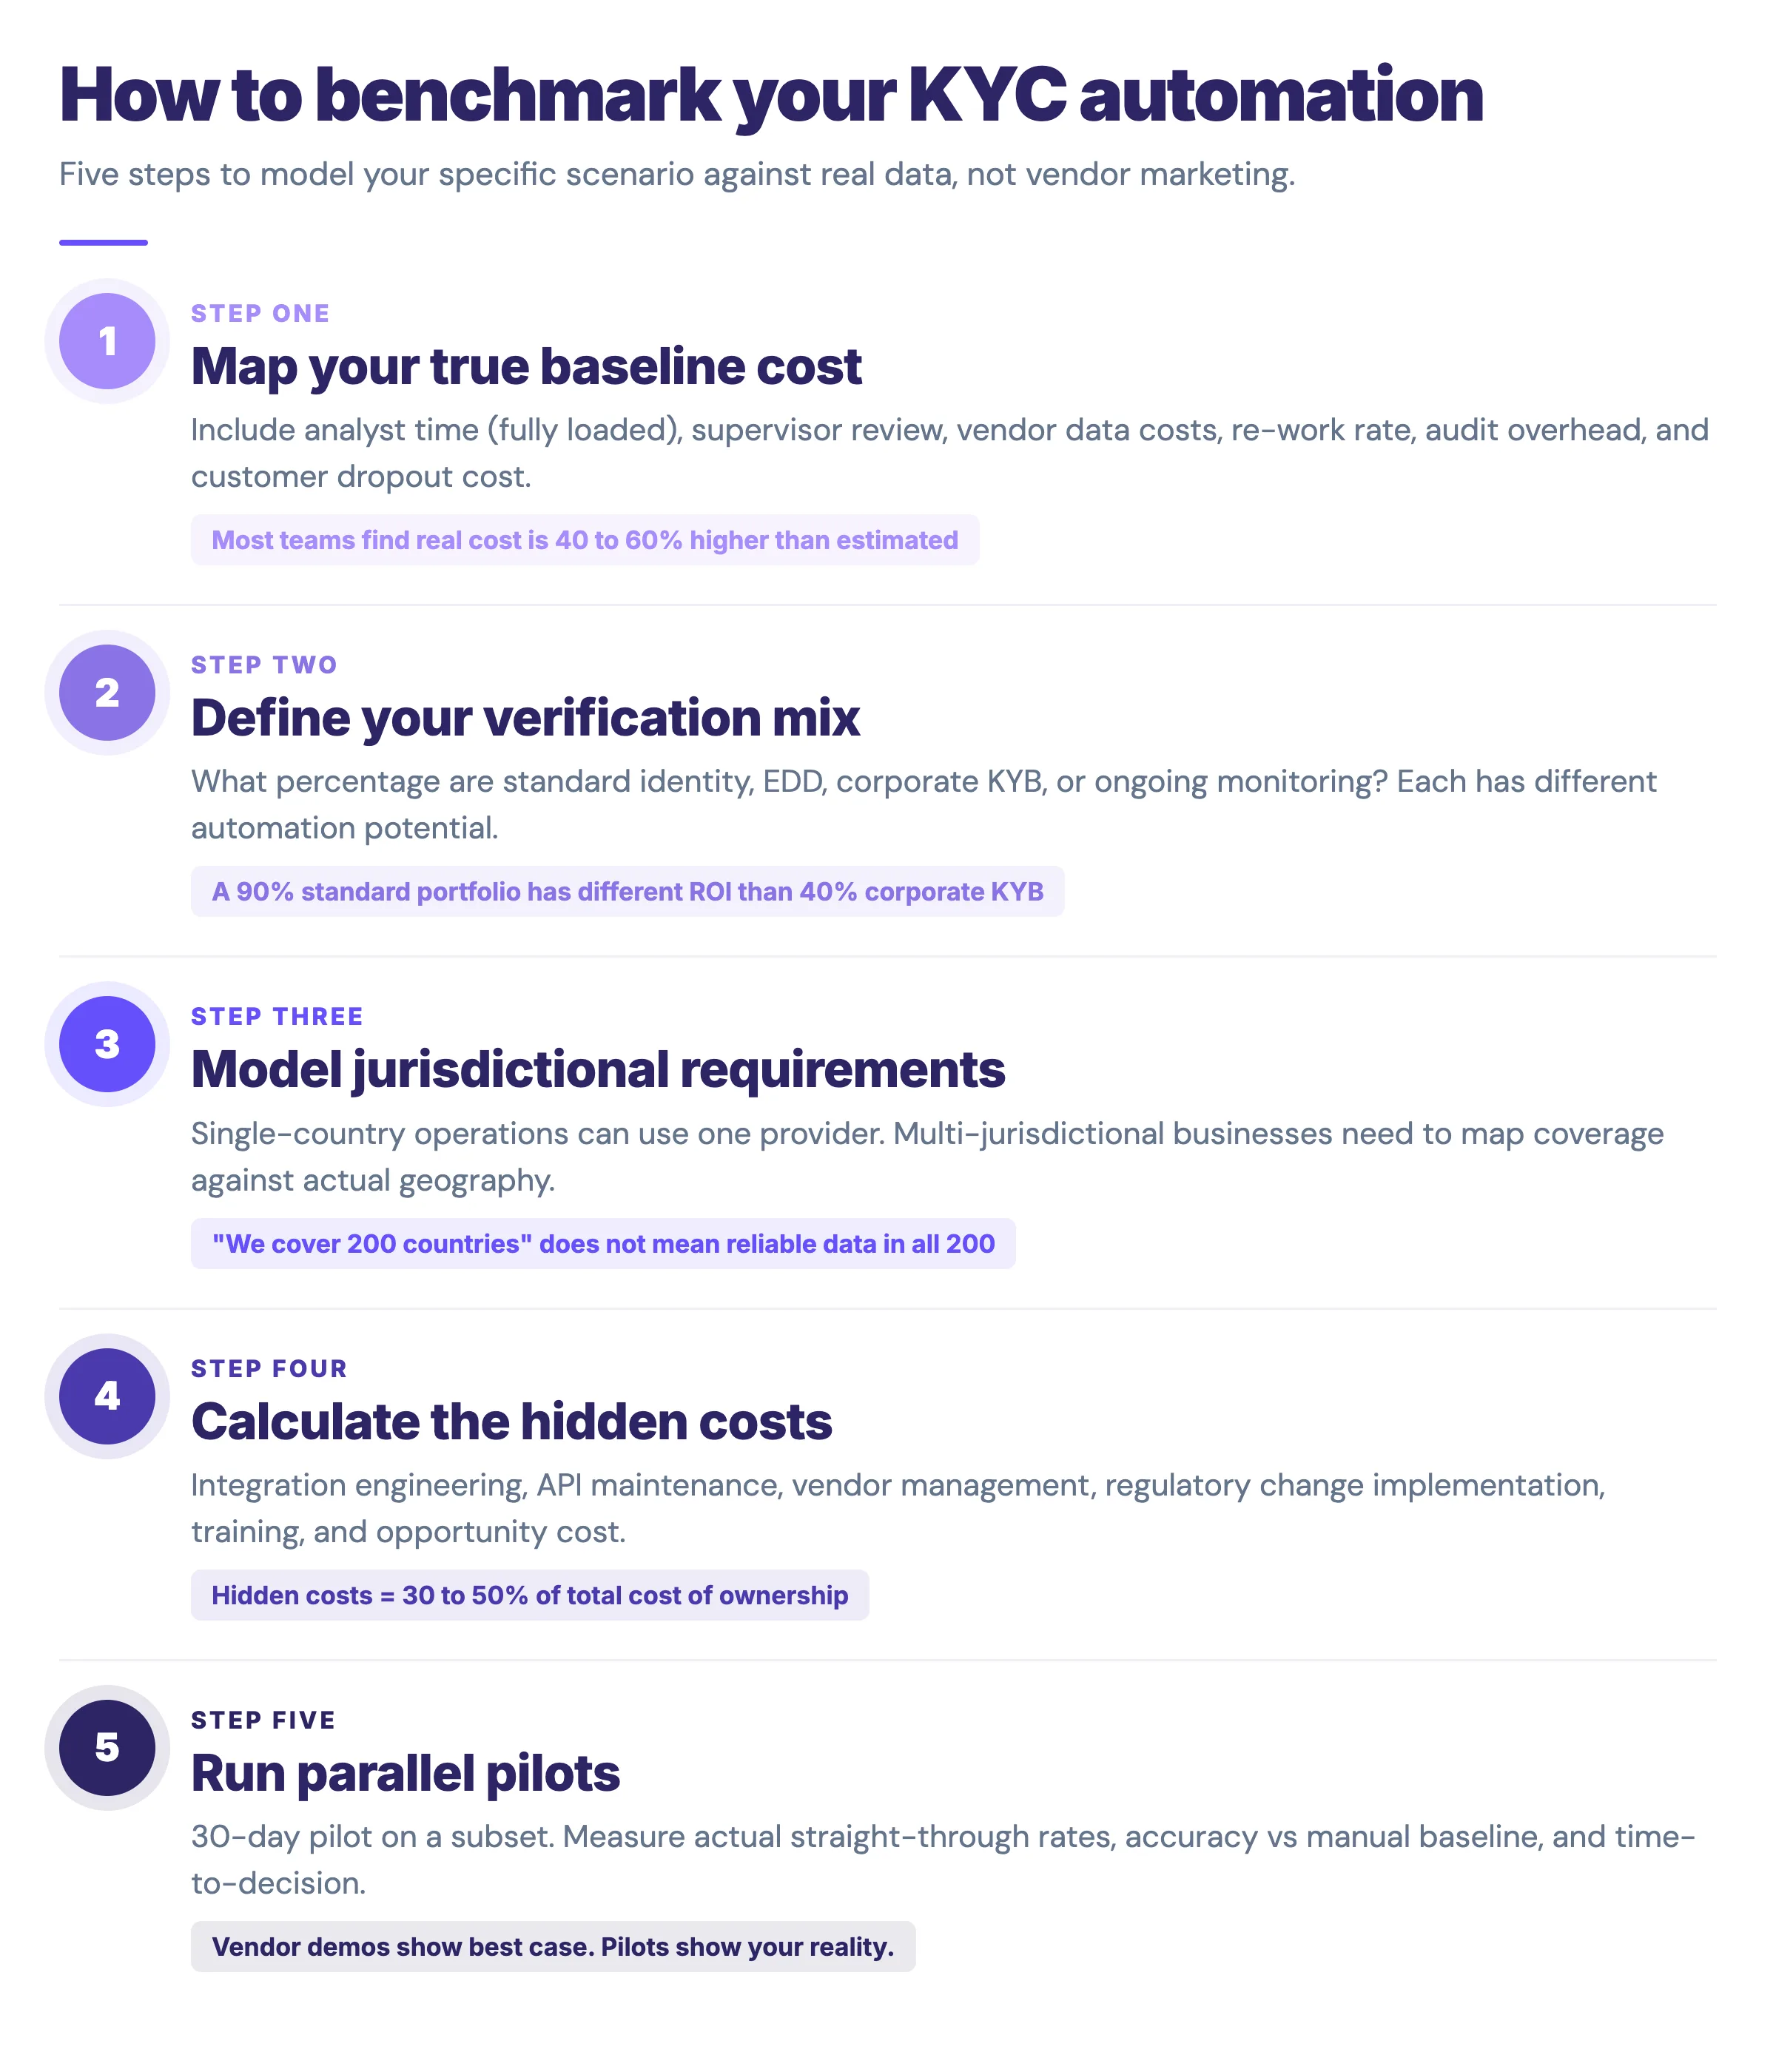
Step 1: Map your true baseline cost. Include analyst time (fully loaded), supervisor review time, vendor data costs, re-work rate, audit documentation overhead, and customer dropout cost from slow onboarding. Most teams find their real cost is 40 to 60% higher than their initial estimate.
Step 2: Define your verification mix. What percentage of your checks are standard identity, enhanced due diligence, corporate KYB, or ongoing monitoring? Each category has different automation potential and cost profiles. A portfolio that is 90% standard identity will see dramatically different ROI from one that is 40% corporate KYB.
Step 3: Model your jurisdictional requirements. Single-country operations can get away with a single provider. Multi-jurisdictional businesses need to map provider coverage against their actual customer geography. The gap between "we cover 200 countries" and "we have reliable data in 200 countries" is where compliance risk lives.
Step 4: Calculate the hidden costs. Integration engineering, ongoing API maintenance, vendor contract management, regulatory change implementation, staff training, and the opportunity cost of your engineering team building compliance infrastructure instead of product features. For most teams, these hidden costs represent 30 to 50% of the total cost of ownership.
Step 5: Run parallel pilots. Before committing to a deployment model, run a 30-day pilot on a subset of your verifications. Measure actual straight-through rates, actual accuracy against your manual baseline, and actual time-to-decision. Vendor demos show best-case scenarios. Pilots show your reality.
Key takeaways
- Manual KYC costs $65 to $160 per verification when you include analyst time, supervision, re-work, and audit overhead, reaching $780K to $1.92M annually at 1,000 monthly checks.
- API-first automation cuts costs to $2 to $8 per check but locks you into single-provider accuracy (85 to 92%) and carries $50K to $180K integration costs plus ongoing maintenance debt.
- Hybrid models promise flexibility but often require 12 to 18 months of rule tuning to prevent rule drift, with manual review handling 20 to 40% of cases despite automation promises.
- Multi-provider orchestration reaches 94 to 98% accuracy and covers 180 to 200 jurisdictions effectively, but integration costs multiply to $200K to $1M across four to six providers without a single orchestration layer.
- White-label SaaS launches in 2 to 6 weeks but creates vendor lock-in: migration costs $100K to $300K and timelines extend 3 to 6 months when you need to switch or adapt.